Fifth Annual Total Tax Contribution Survey
Canadian corporate income tax payments rose sharply in 2016
Foreword
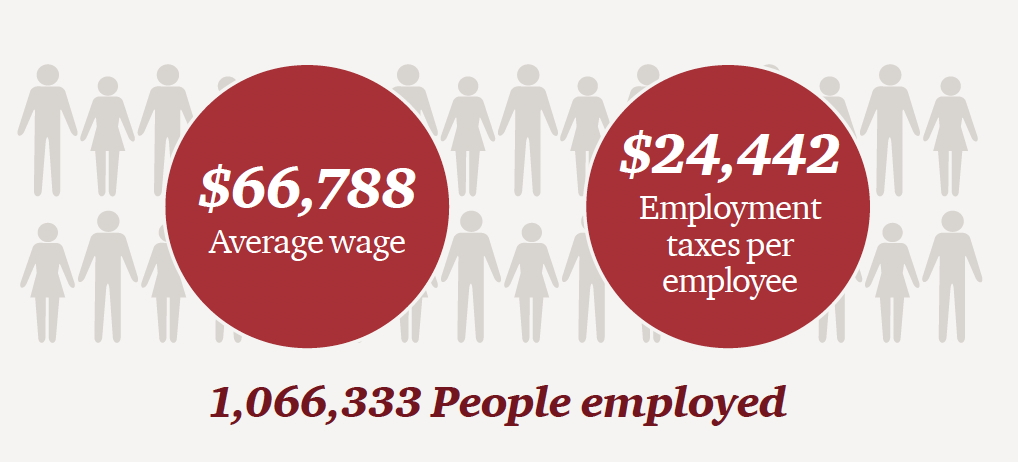
Welcome to the fifth annual Total Tax Contribution survey of Business Council of Canada members. Eighty-seven of Canada’s largest businesses provided tax data for the 2016 fiscal year, demonstrating the significant contribution these large businesses make to public finances and to the Canadian economy. Together, they make major capital investments and drive innovation through spending on R&D, as well as providing employment to over one million people, generating, on average, $24,442 per person in employment taxes.
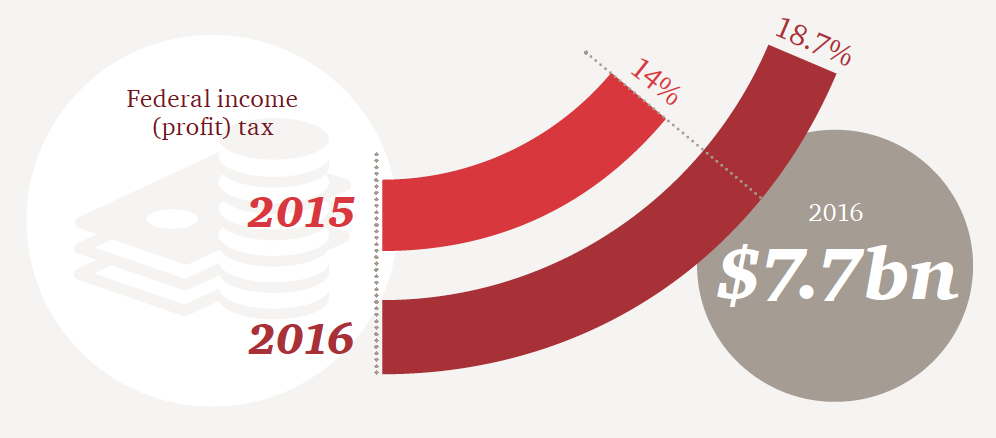
After a challenging 2015, marked by declines in Canadian commodity prices that resulted in lower Canadian corporate profits, the Canadian economy registered stronger growth in 2016. Our survey saw this reflected in increased profitability and associated growth in tax receipts, driven by a 30% increase in corporate income tax receipts. This group of large businesses contributed 18.7% of total federal corporate income tax (up from 14% in the previous year).
In total, the companies participating in this survey contributed $68.3 billion to public finances, $4.5 billion more than in the previous year. They paid $26.5 billion in taxes borne (taxes that are a cost to the company), collected $38.1 billion on behalf of their employees and customers, and paid another $3.7 billion in royalties and other fees. Federal corporate income tax made up $7.7 billion of this total.
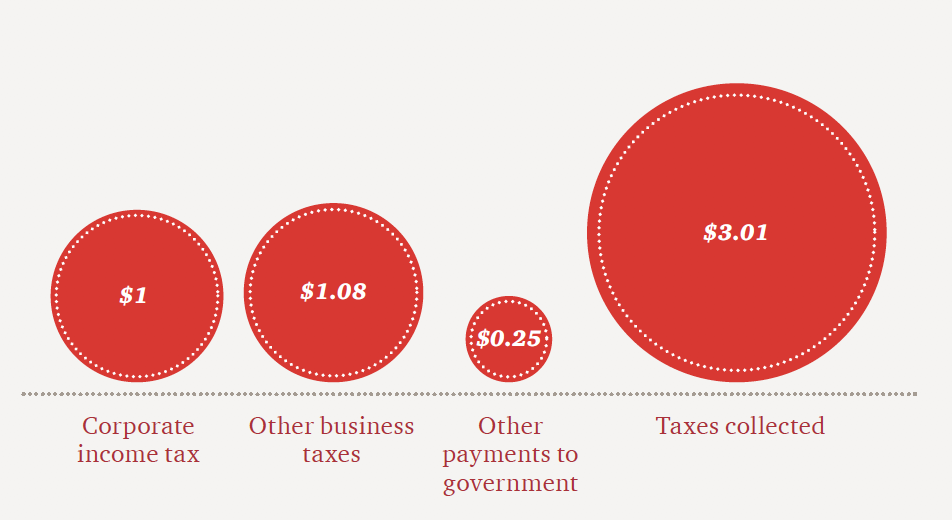
Corporate income tax is only one of 68 different taxes, fees and royalties, large Canadian companies pay to the three levels of government. For every dollar paid in corporate income tax, companies surveyed paid another $1.08 in other business taxes and $0.25 in other payments to government. An additional $3.01 is contributed through taxes collected from customers and employees.
Looking to the future, there have been important developments in tax legislation affecting Canada’s major trading partners over the last year, most significantly with tax reform in the US. The reduction in the US federal corporate income tax rate from 35% to 21% will have a considerable impact on business decisions, in North America and around the world. The average effective US federal-state corporate income tax rate has now fallen below the effective Canadian federal-provincial corporate income tax rate. Combined with other US tax reform measures encouraging business investment in the US, as well as measures which may increase the cost of cross-border business with the US, there is considerable concern that Canada’s corporate tax system has lost its competitive edge.
Furthermore, the global trend towards greater tax transparency (both legislative and voluntary) continues, with more extensive disclosures expected to arise within a number of jurisdictions.
In this context, a wider public debate about Canada’s tax system would be welcome. We hope that this survey serves to enrich the public narrative with meaningful data to enhance national business trust, inform constructive debate and contribute to forward-thinking policy reform.
We thank the Business Council of Canada for continuing to support this survey, and encourage business leaders and other stakeholders to engage with the tax agenda in the future.

Peter van Dijk, PwC Canada

Andrew Packman, PwC UK
Key Findings
Total Tax Contribution
The Total Tax Contribution (TTC) for the participants in 2016 was $64.6 billion: $26.5 billion in taxes borne and $38.1 billion in taxes collected. Participants made a further $3.7 billion in other payments, such as royalties.
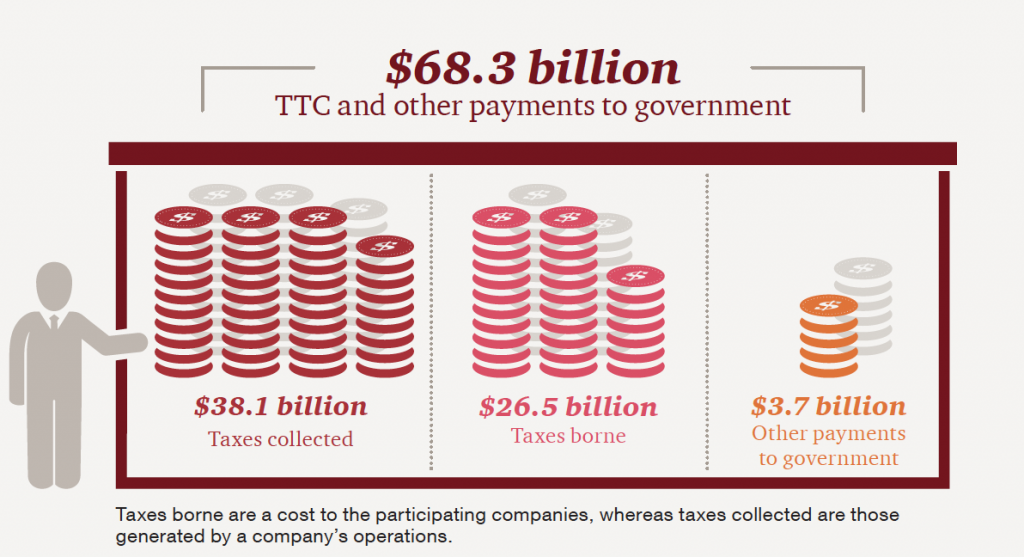
An increasing contribution in 2016
On a like-for-like basis, TTC and other payments to government in 2016 have increased compared to 2015 by 5.7%. This is made up of increases in both taxes borne (6 percentage points) and taxes collected (1.1 percentage points), partially offset by a decrease in other payments to government (1.4 percentage points).
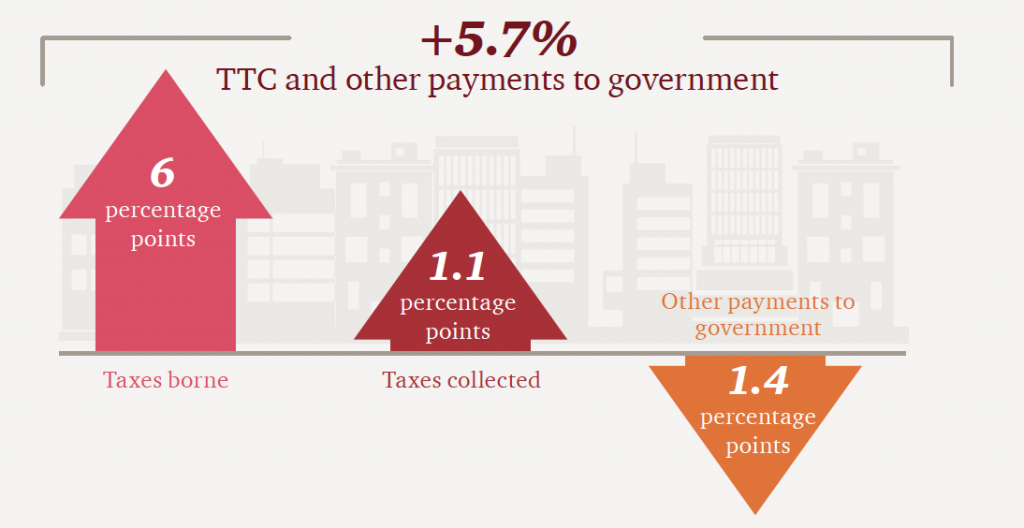
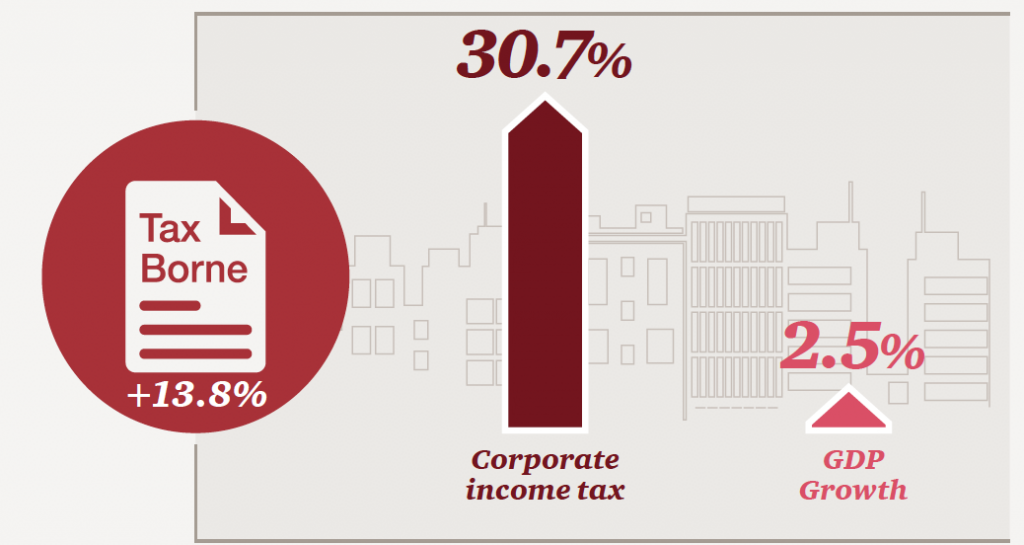
With a stronger economy in 2016, profits and corporate income tax both increased
The overall increase in taxes borne (up 13.8% compared to 2015) was driven by an increase in corporate income tax (up 30.7%), particularly from the banks in the study. The Canadian economy was stronger than in 2015, registering GDP growth of 2.5% in 2016. The increase in corporate income tax reflects increasing profits compared to 2015.
18.7% of federal income (profit) tax
Survey participants contributed 18.7% ($7.7bn) of total federal corporate income tax revenue (compared to 14% in 2015).
Corporate income tax is not the only tax paid
For every dollar of corporate income tax, the survey participants paid a further $1.08 (2015: $1.59) of other business taxes and $0.25 in other payments to government. For every dollar of corporate income tax paid by the participants, there was another $3.01 (2015: $3.48) in taxes collected.
Council members are an important source of well-paid jobs in Canada
Participants provided employment to more than one million people and paid an average wage of $66,788 (32% higher than the national average). These jobs generated an average of $24,442 in employment taxes per employee, reflecting taxes borne by the participants and collected on behalf of employees.
Total Tax Rate
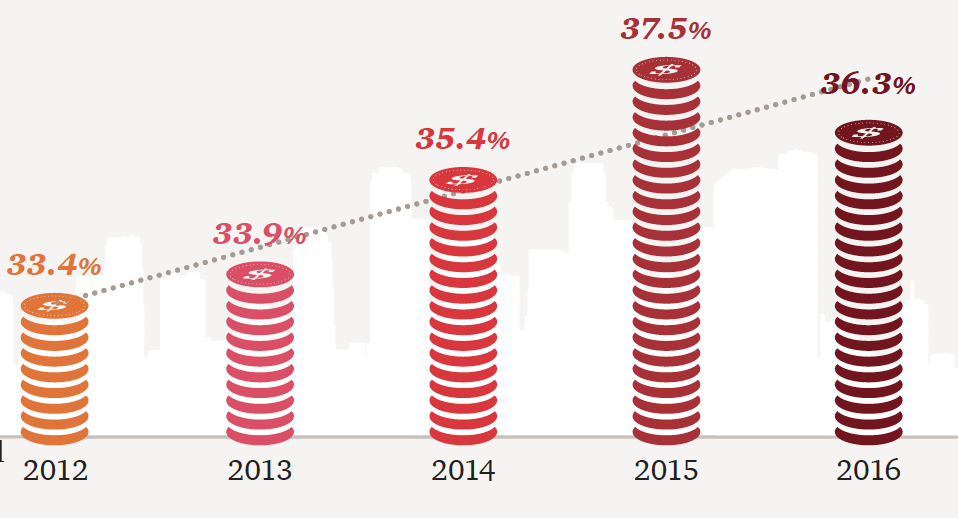
The Total Tax Rate is a measure of the total tax burden of participants. The calculation is total taxes borne – corporate income tax plus all other taxes borne – as a percentage of profit before taxes borne.
On average in 2016, the participants were subject to a TTR of 36.3%. The TTR trend indicates that the burden of tax has been increasing, peaking in 2015 when commodity prices were low, impacting profits. When profits fall, corporate income tax payments will decrease. Other taxes, which are not dependent on profit, do not fall by the same amount and so the TTR rises.
The burden of tax compliance
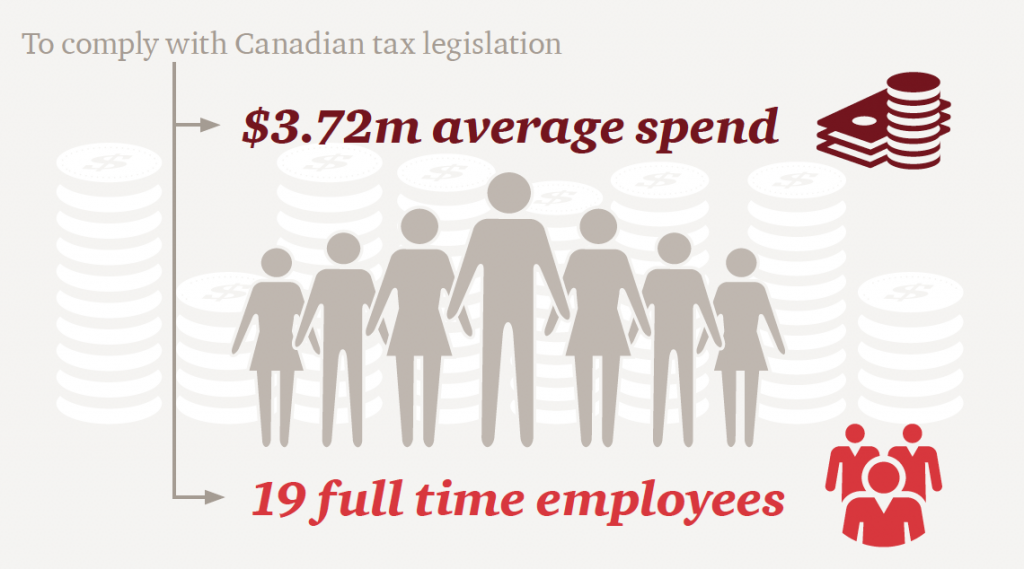
On average, the 87 participants spent $3.72m and employed 19 full-time employees to comply with Canadian tax legislation. The cost to business in dealing with compliance obligations is an important part of the overall picture.
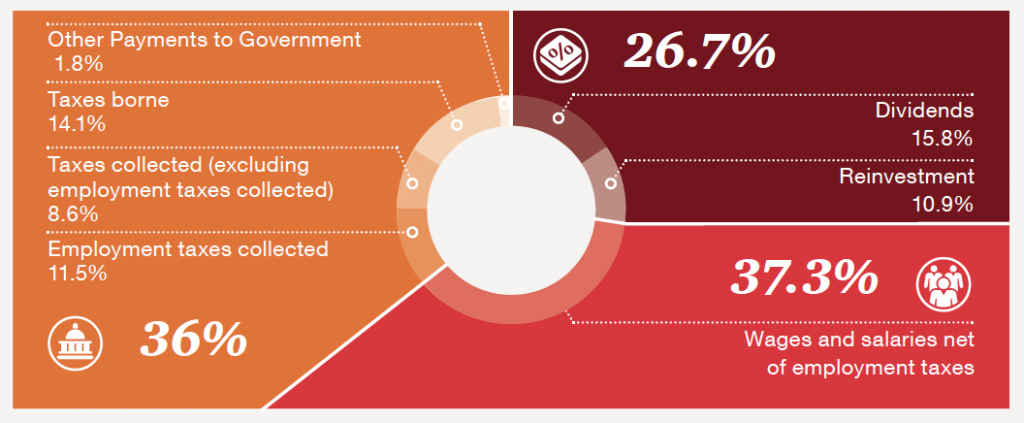
36% of the value distributed goes to the government in taxes
Compared to wages paid to employees and profit retained in the business, paid as dividends or used for share repurchase, 36% of value goes to the three levels of government: federal, provincial and municipal. Value distributed consists of earnings of the businesses as well as labour costs and all taxes and other payments to government.
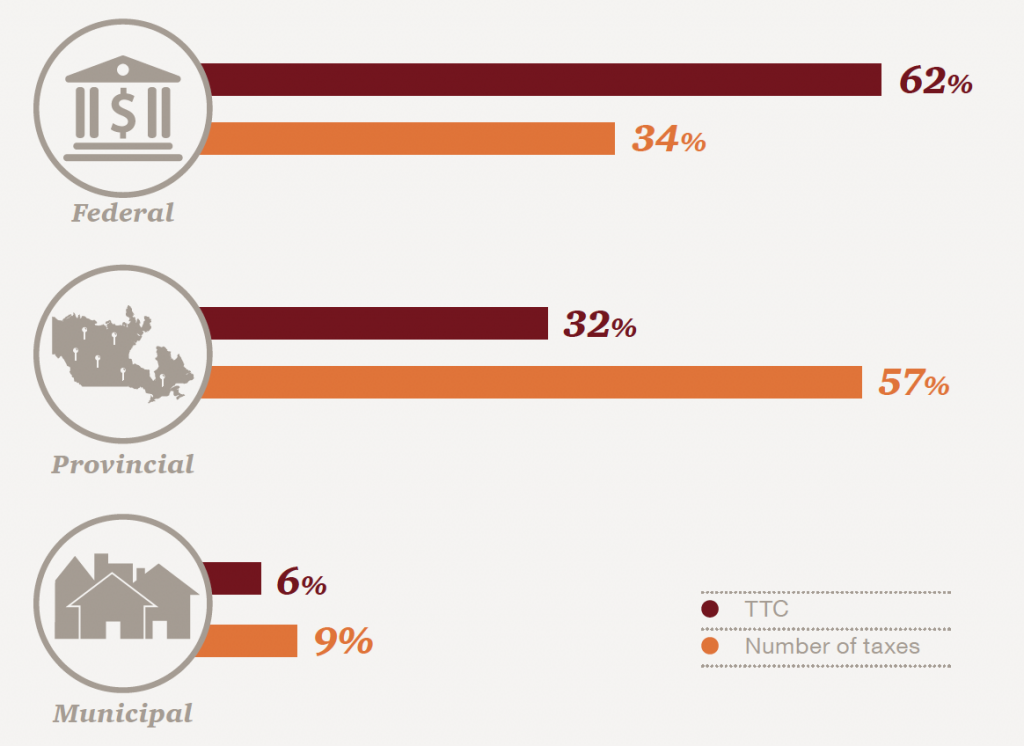
Total Tax Contribution by level of government
Federal taxes account for 62% of the Total Tax Contribution of the companies surveyed. In total, this federal tax revenue was collected from 19 different taxes, representing 34% of the total number of taxes paid by participants.
At the provincial level, 32% of the Total Tax Contribution was collected from 32 different taxes, representing 57% of the total number of taxes paid by participants.
The remaining 6% was collected through municipal taxes.
87 companies provided data for the Total Tax Contribution survey
This represents 52% of the Business Council of Canada’s membership.
About
Business Council of Canada
The Business Council of Canada is a not‑for‑profit, non‑partisan organization composed of the CEOs of Canada’s leading enterprises. The Council engages in an active program of research, consultation and advocacy on issues of national importance to the economic and social fabric of Canada.
Member CEOs and entrepreneurs represent all sectors of the Canadian economy. The companies they lead collectively administer $8.7 trillion in assets, have annual revenues in excess of $1.1 trillion, and are responsible for the vast majority of Canada’s exports, business investment, private‑sector research and development, and employer-sponsored education and training.
PwC
PwC Canada helps organizations and individuals create the value they’re looking for. More than 6,700 partners and staff in offices across the country are committed to delivering quality in assurance, tax, consulting and deals services. PwC Canada is a member of the PwC network of firms with more than 236,000 people in 158 countries.
Total Tax Contribution
The Total Tax Contribution methodology identifies taxes borne and taxes collected. Taxes borne by a company are a cost to the company and reflected in its financial results, e.g. federal and provincial corporate income (profit) tax and irrecoverable sales taxes.
Taxes collected are those generated by a company’s operations, but which do not affect its results, e.g. payroll taxes withheld from employees and remitted and GST/HST collected from customers and remitted.
We identified 68 business taxes and other payments to governments in this survey under the Total Tax Contribution methodology. Taxes are categorized into five tax bases, i.e. profit taxes, production taxes, employment taxes, property taxes and environmental taxes.


